Hedge Funds Versus Hedged Mutual Funds: An Examination of Equity Long/Short Funds; A Performance Update
David F. McCarthy
D.F. McCarthy LLC
dfm@dfmccarthy.com
and
Brian M. Wong
SUMMARY AND KEY FINDINGS
May 1, 2020
Introduction
After a period of initial asset growth, questions are increasingly being asked of liquid alternative mutual funds. See, for example: "Liquid Alternatives Haven't Lived Up to the Hype (Yet)." Morningstar Blog (August 2, 2018), and "Liquid Alternatives: Alternative Enough?" CFA Institute, (September 24, 2018).
To better understand how a segment of this market is performing this paper updates an earlier work, "Hedge Funds Versus Hedged Mutual Funds: An Examination of Long/Short Funds" (The Journal of Alternative Investments, Winter 2014; referred to herein as McCarthy (2014)). This new paper is divided into two sections. Section One focuses on the performance of the equity long/short mutual funds examined in McCarthy (2014) for the period July 1, 2013 - December 31, 2019, an extended bull market period for US equities. As in McCarthy (2014), the performance of these equity long/short mutual funds is compared to the S&P 500 Index and traditional hedge fund indexes, and are segmented into funds sponsored by diversified investment firms versus specialized investment firms. Included are analyses of comparative correlations and betas, absolute and risk-adjusted returns, performance persistence, survivorship rates, the substantial change in individual fund size, and the effect of performance on asset flows.
Section Two of the paper examines the performance of these equity long/short mutual funds vs. the S&P 500 Index over January 1, 2020 – March 31, 2020, a period characterized by a sharp equity market selloff. Finally, the paper includes an appendix examining equity long/short mutual funds begun after July 2013. The data indicates that the performance of funds begun after July 2013 is indistinguishable from those begun before that date.
Below is a summary of the key findings of this paper. The full paper will be published in The Journal of Alternative Investments; Fall 2020.
Key Findings:
Section One – July 2013 – December 2019
Key Finding #1: Equity long/short mutual funds substantially underperformed the S&P 500 Index over the period July 2013 - December 2019.
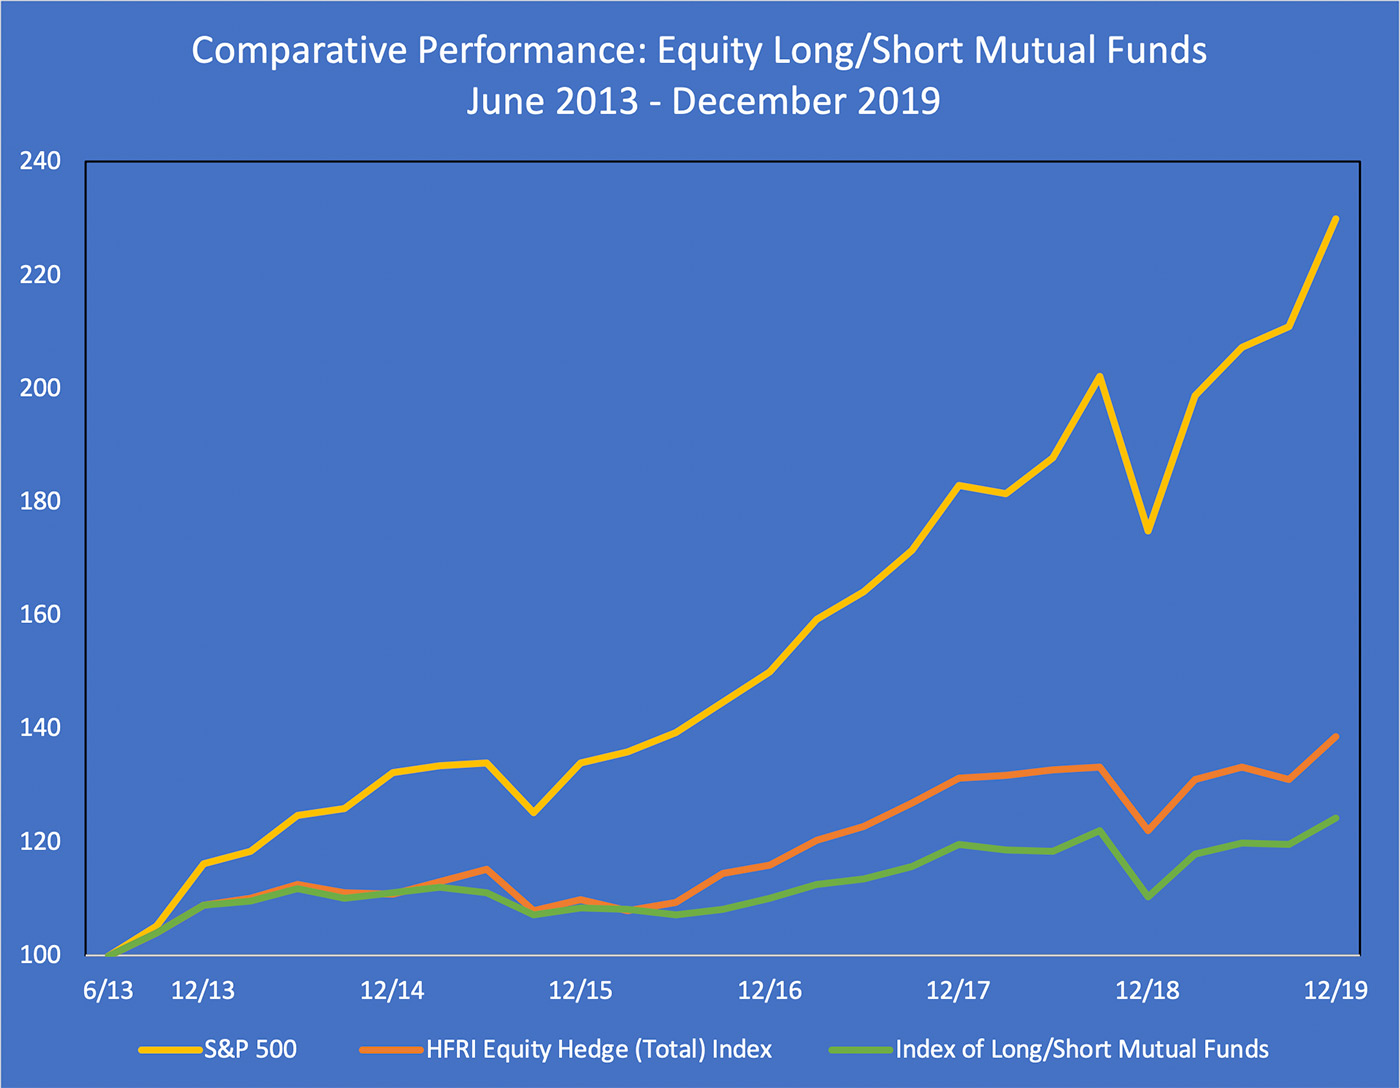
This underperformance was quite substantial in absolute return terms (13.7% p.a. for the S&P 500 versus 3.4% p.a. for the Index of Equity Long/Short Mutual Funds). Further, the Index of Long/Short Mutual Funds had poor risk adjusted performance (i.e. as measured by single factor alpha). As a group, equity long/short mutual funds generated -4.0% p.a. alpha over this period, with no single mutual fund generating a positive alpha. The graph below illustrates the comparative cumulative performance over this period of the S&P 500 Index, the HFRI Equity Hedge (Total) Index, and the Index of Equity Long/Short Mutual Funds.
Key Finding #2: Equity long/short mutual funds exhibited a similar correlation and beta to the S&P 500 as traditional equity hedge fund indexes.
The Index of Equity Long/Short Mutual Funds demonstrated a similar correlation, standard deviation, and beta to the S&P 500 over the July 2013 - December 2019 period as leading equity hedge fund indexes. This is consistent with McCarthy (2014) indicating that equity long/short mutual funds continue to employ strategies and leverage similar to traditional hedge funds.
Key Finding #3: Equity long/short mutual funds underperformed leading equity hedge fund indexes.
Despite having slightly higher beta to the S&P 500 over the July 2013 – December 2019 period, the Index of Equity Long/Short Mutual Funds underperformed three leading hedge fund indices. Comparative performance for the Index of Equity Long/Short Mutual Fund Index, the HFRI Equity Hedge (Total) Index, the DJ-CS L/S Equity Hedge Fund Index, and the CISDM Equity Long/Short Index from July 2013 - December 2019 were 3.4% p.a., 5.2%, 5.4%, and 6.2%, respectively. While these differences are not statistically significant, they do differ from the earlier findings in McCarthy (2014) where returns were approximately equal.
Key Finding #4: Equity long/short mutual funds sponsored by diversified investment firms continued to outperform those sponsored by specialized investment firms.
As was the case in McCarthy (2014), the equity long/short mutual funds sponsored by diversified investment firms held an approximately 180BP per annum performance advantage over those sponsored by specialized investment firms for the period July 2013 – December 2019. Approximately half of the difference in this later time period may be explained by the higher beta of those funds sponsored by diversified investment firms.
Key Finding #5: There is no evidence of positive performance persistence among equity long/short mutual funds.
Top performing equity long/short mutual funds (i.e. in the top half of comparable funds) in one year showed a roughly equal chance of being in the top half or bottom half in the subsequent year. Bottom half performers in one year were also approximately equally likely to be in the top or bottom half, but with a slightly higher likelihood of being shut down in the subsequent year.
Key Finding #6: The equity long/short mutual funds in this analysis experienced a period of rapid AUM growth from 2013 to 2014, with an equivalent outflow by the end of 2019.
The average size of an equity long/short mutual fund in December 2019 was approximately the same as in January 2013. However, that masks the very substantial change in assets (up and down) over that period as the table below shows.
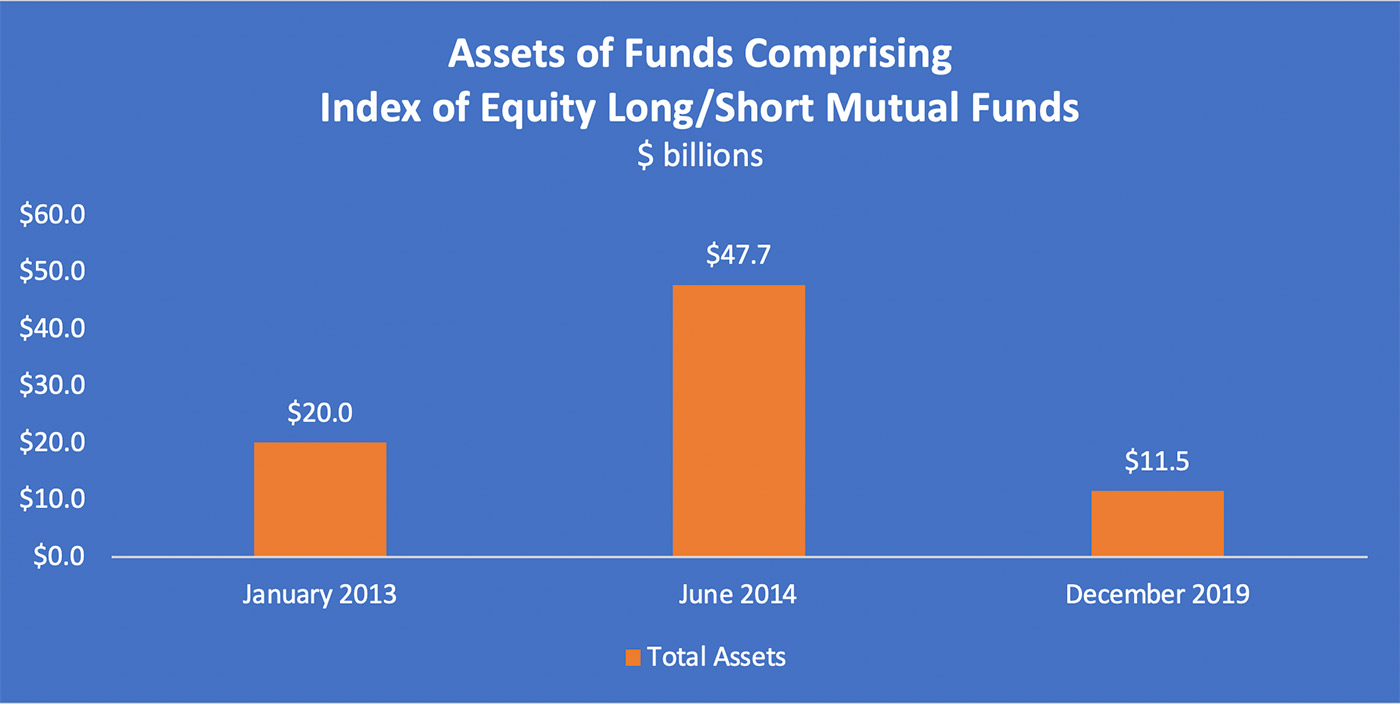
Assets managed by the mutual funds in this analysis more than doubled from January 2013 to June 2014. That increase was then more than completely reversed by December 2019. Additionally, the five largest funds as of January 2013 held $13.7B in assets. By December 2019, assets in these five funds had declined to $4.0B (a 71% decline), with only one of them still among the five largest.
Key Finding #7: The fund closure rate of equity long/short mutual funds was similar to that of long only equity mutual funds.
Of the 47 funds in this category as of January 2013 (see McCarthy (2014)), 19 closed before December 2019, and another 4 substantially changed investment strategy. This rate of closure was found to be similar to that of general US equity mutual funds over this time period.
Key Findings:
Section Two – January 2020 – March 2020
Key Finding #8: The Index of Equity Long/Short Mutual Funds outperformed the S&P 500 Index during Q1 2020, though losses in both were in the double digits.
Over the period January 1, 2020 – March 31, 2020, the Index of Equity Long/Short Mutual Funds lost less than the S&P 500 Index. Results for this period were -12.7% and -19.6% respectively. Given the modest beta to the S&P 500 for the equity long short mutual funds (i.e. 0.63 for the 12 months to December 2019, and 0.50 for Q1 2020 (daily data)), it is not surprising that these mutual funds lost less. However, it should be noted that 4 of the 24 mutual funds in the sample (i.e. 17%) earned a positive return over this sharply negative period for US equities. Performance data for Q1 2020 and two longer time periods are shown below.
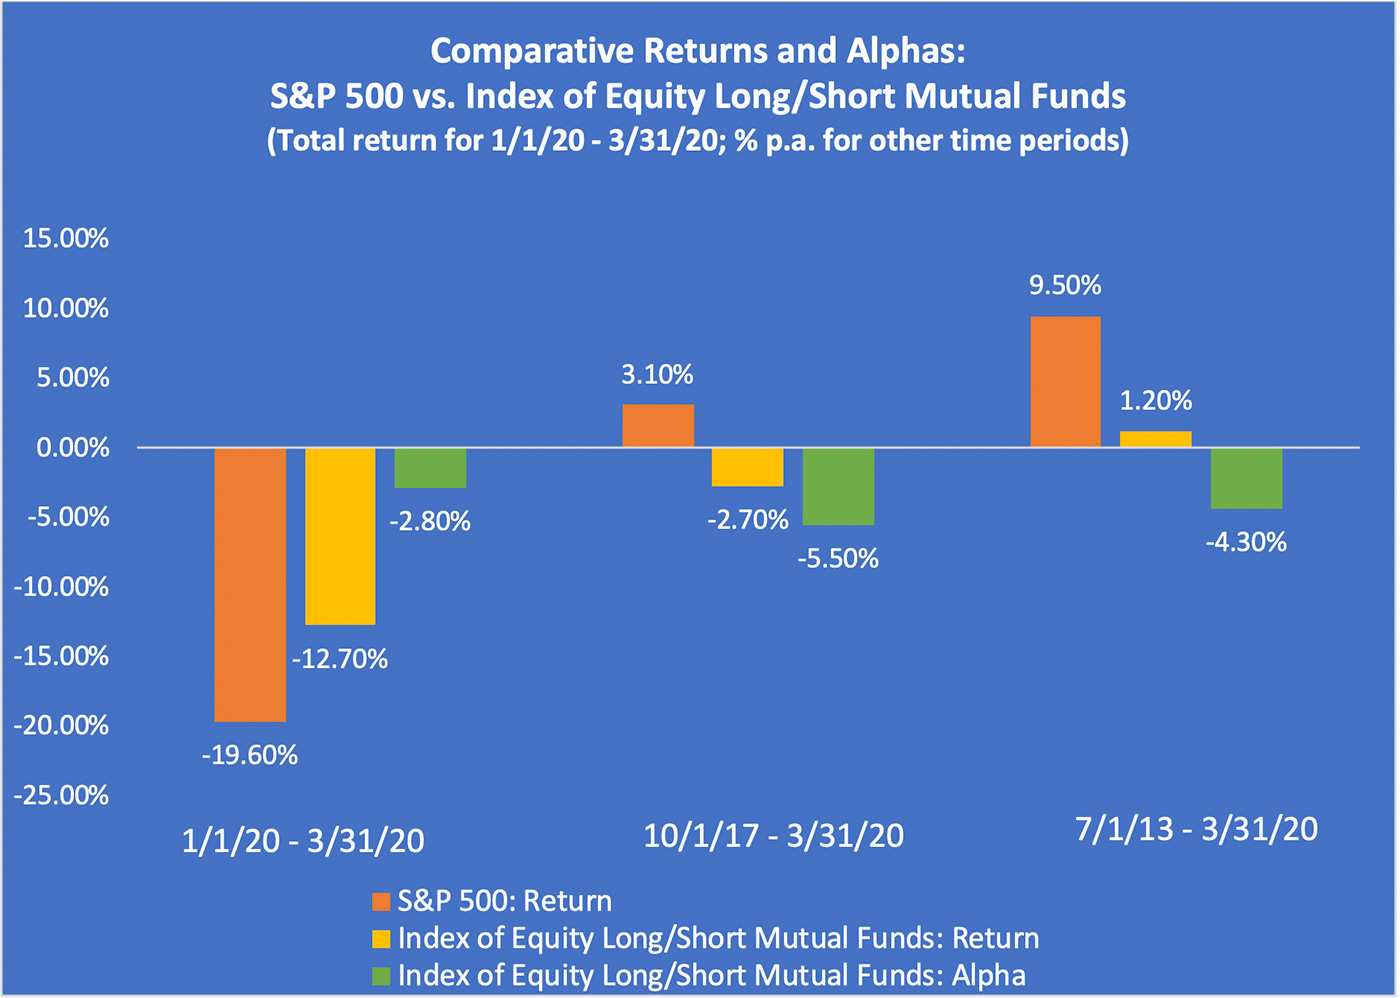
Key Finding #9: The Index of Equity Long/Short Mutual Funds generated negative alpha during Q1 2020. However, a few individual mutual funds did generate a positive alpha.
Over Q1 2020, the Index of Equity Long/Short Mutual Funds had a single factor alpha of -2.8% (quarterly, not annualized). Eight of the 24 funds (33%) earned a positive alpha over this three-month period. As shown in the table above, extending this analysis to 30 months and 81 months and ending March 31, 2020 show sharply negative alpha for the Index of Equity Long/Short Mutual Fund. Further, extending the time period also saw a substantial drop off in the number of individual funds generating positive alpha (i.e. 5 of 24 funds over the 30 months and 2 of 24 funds over the 81 months).